Archive for the ‘Azure’ Category
What is digital twin? – Part 1
What is digital twin?
Virtual representation of real world item or process.
Digital twin platform enables us to actually collect this data, process it, provide insights and then enable us to take some actions based on the data. More specifically take proactive measures instead of reactive measures. General its used for items but we can also use it for processes. I will explain on how we can use digital twin for processes.
What are types of Twin?
- Digital Model/Simulator: Here we manually feed data into a existing model to see its results. If we have seen the movie ‘Day After Tomorrow’, the scientist inputs data from various locations in the existing model and can predict what the world would go through in next few days.
- Digital Shadow: Here real world devices/sensors send IOT data to virtual platform. Lets assume we have a physical car and a wheels in your car has a sensor wheel which is sending data to the a cloud based digital twin wheel (Virtual representation of car). This will help understand when your car tires needs to be replaced or repaired. A real life example is Michelin Fleet Solutions.
- Digital Twin: Here we have 2 way data sync from sensor to the digital twin and may receive some action based on input provided. Example here is where we have a multistory warehouse which has sensor on all most critical components, water supply, electricity circuit, elevators, co2 level, AC etc. Based on feedback of the sensors, temperature(Cold storage) in one section of the warehouse is different and other section(Meeting room).
Typical Digital Twin functions
- Visualize current state of item or process
- Trigger alerts under certain conditions
- Review historic data
- Simulate scenarios
Few Benefits:
- Helps save money incase we go live/production with a major defects or avoid downtime at all.
- Learn from past scenarios.
- Help increase safer work environment.
- Increase Quality / efficiency / life of the products/organization.
How are digital twin used in real world?
As I have already shared, Michelin Fleet Solutions now sells kilometers instead of tyres to make profit and sensor in wheel of car is sending data to the a cloud based digital twin wheel (Virtual representation of car).This will help understand when your car tires needs to be replaced or repaired. Also they provide feedback to customer on which routes to take and what time to travel to avoid reduce lifespan of the wheels.
Another example is where a supermarket monitors all the customers as to which section they visit most, which is most visible section for adds, how many people buy what kind of items from check out counters, etc. This helps them to place new products / high margin products in that area with high footprint and also plan a longer exit path so because physiologically, the more time a person spends in the store, the more he would purchase.
Origins of digital twin
John Vickers who was Principal technologies invented the word digital twin back in 2010.
Michael Grieves then worked with Vickers to create digital twin of few real life items. It got boost after IOT growth accelerated.
One of the best example is Digital Twin Victoria(Australia)
Permission or URL issue when you use Azure Digital Twin explorer for the 1st time
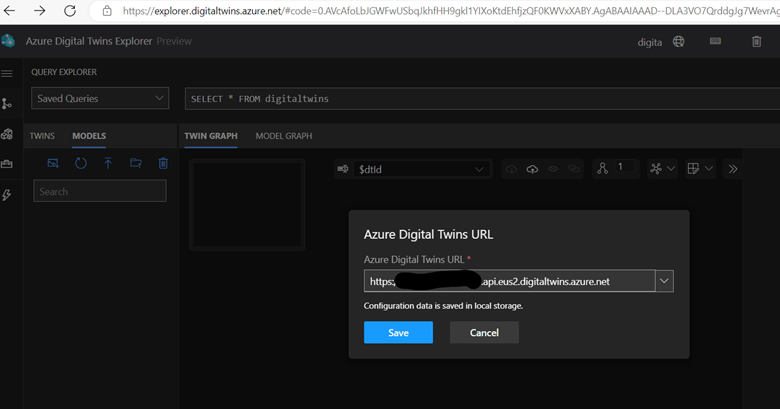
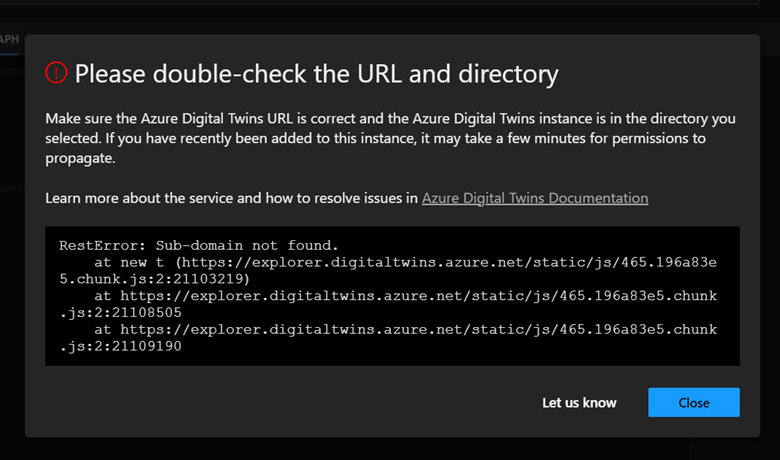
Error : ‘Double check URL and directory’ or ‘you don’t have permission on the Digital twin URL’
RestError: Sub-domain not found.
at new t (https://explorer.digitaltwins.azure.net/static/js/465.196a83e5.chunk.js:2:21103219)
at https://explorer.digitaltwins.azure.net/static/js/465.196a83e5.chunk.js:2:21108505
at https://explorer.digitaltwins.azure.net/static/js/465.196a83e5.chunk.js:2:21109190
To resolved these errors follow below steps
- In the Azure portal, navigate to the Digital Twins resource
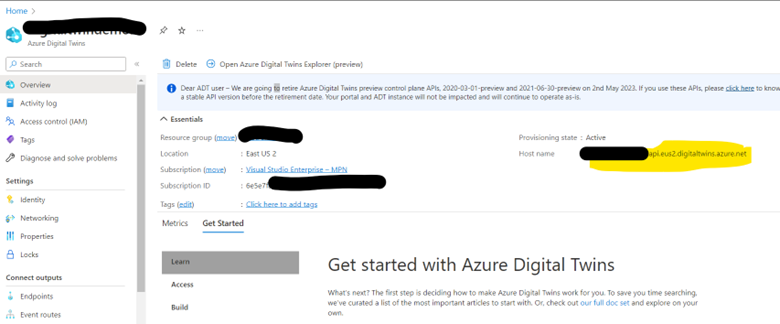
- Make sure you use the URL given on your Digital Twin Overview screen in front of Hostname as shown above, make sure you start with https://
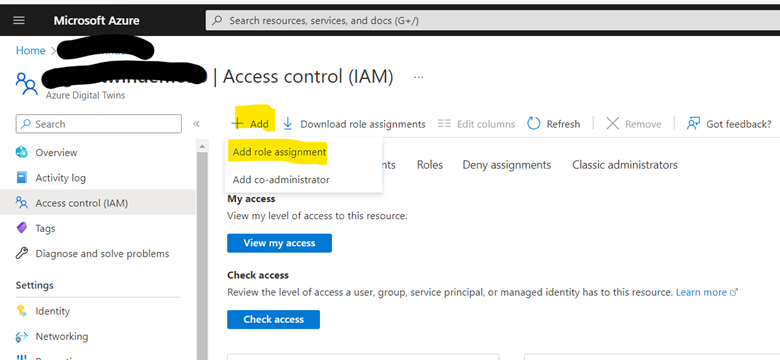
- Also give appropriate permission to yourself by clicking on the Access Control (IAM) menu
- Select Add role assignment
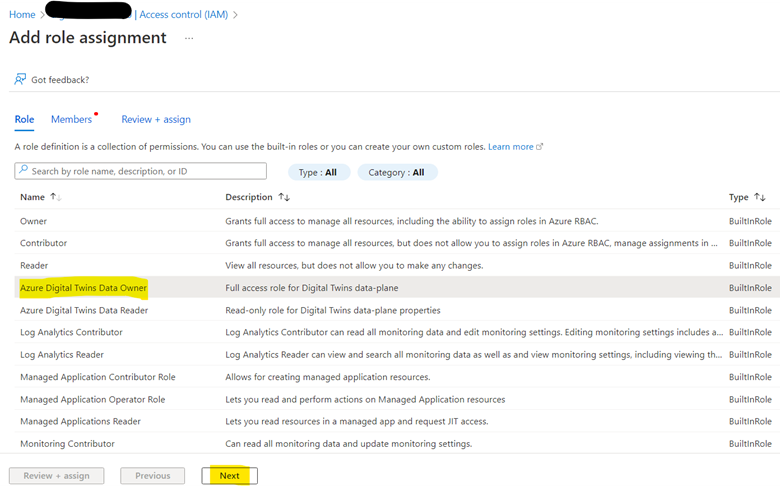
- Select Azure Digital Twins Data Owner in the Role dropdown listbox
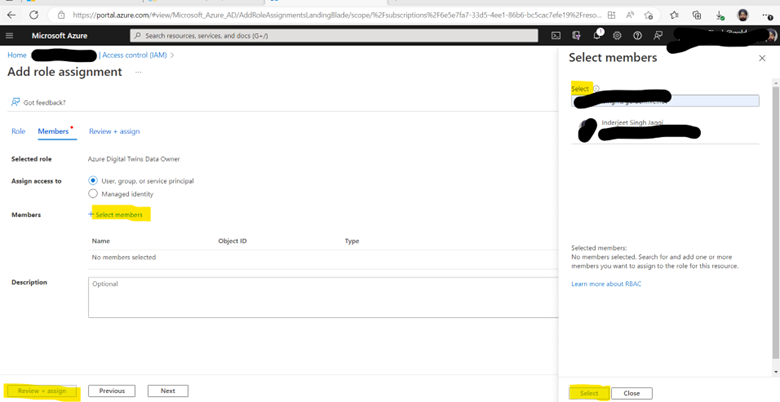
- For the Assign access to setting, select User, group, or service principal
- Now, select the user that you are using in the Azure portal right now and that you’ll use on your local machine to authenticate with the sample application
- Click Save to assign the Role
Quick overview of Azure Data Explorer
A big data analytics platform called Azure Data Explorer makes it simple to quickly evaluate large amounts of data. You may get a complete end-to-end solution for data ingestion, query, visualization, and administration with the Azure Data Explorer toolset.
Azure Data Explorer makes it simple to extract critical insights, identify patterns and trends, and develop forecasting models by analyzing structured, semi-structured, and unstructured data over time series. Azure Data Explorer is helpful for log analytics, time series analytics, IoT, and general-purpose exploratory analytics. It is completely managed, scalable, secure, resilient, and enterprise ready.
Terabytes of data may be ingested by Azure Data Explorer in minutes in batch or streaming mode, and petabytes of data can be searched with millisecond response times. Data can be ingested in a variety of structures and formats. It may enter from a number of channels and sources.
The Kusto Query Language (KQL), an open-source language created by the team, is used by Azure Data Explorer. The language is straightforward to comprehend and learn, and it is quite effective. Both basic operators and sophisticated analyses are available. Microsoft makes extensive use of it (Azure Monitor – Log Analytics and Application Insights, Microsoft Sentinel, and Microsoft 365 Defender). KQL is designed with quick, varied big data exploration in mind. queries any other tabular expressions, including views, functions, and tables. This can involve clusters or even tables from various databases.
Each table’s data is kept as data shards, commonly referred to as “extents.” Based on the ingestion time, all data is automatically indexed and partitioned. There are no main foreign key requirements or other restrictions, like as uniqueness, unlike a relational database. As a result, you may store a wide variety of data and quickly query it thanks to the way it is kept.
Azure Data Explorer
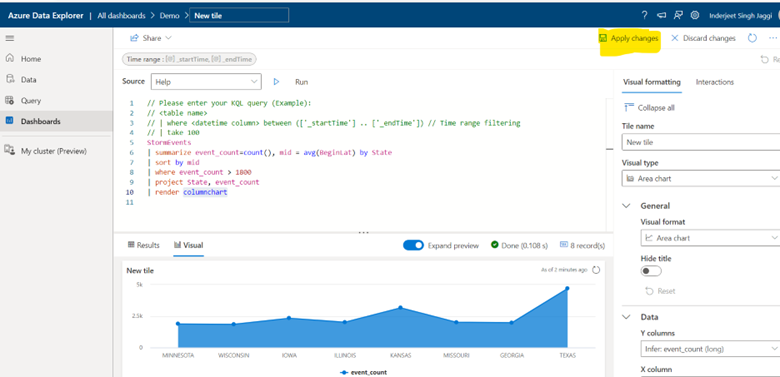
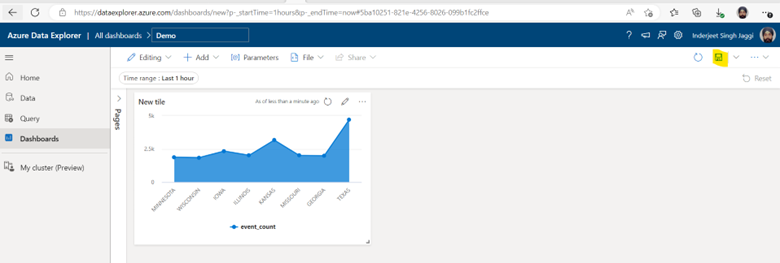
ADX Dashboards is a newly released feature from Microsoft which provide the ability to create various types of data visualizations in one place and in an easy-to-digest form. Dashboards can be shared broadly and allow multiple stakeholders to view dynamic, real time, fresh data while easily interacting with it to gain desired insights. With ADX Dashboards, you can build a dashboard, share it with others, and empower them to continue their data exploration journey. You can say, this is a cheap alternative to PowerBI.
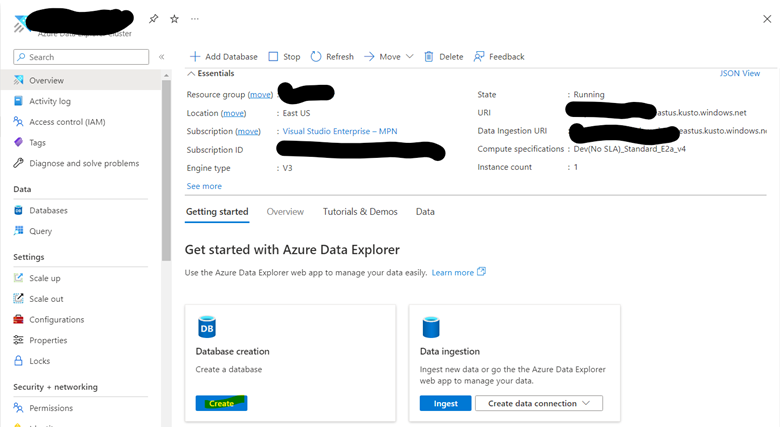
- Create Azure data explorer cluster
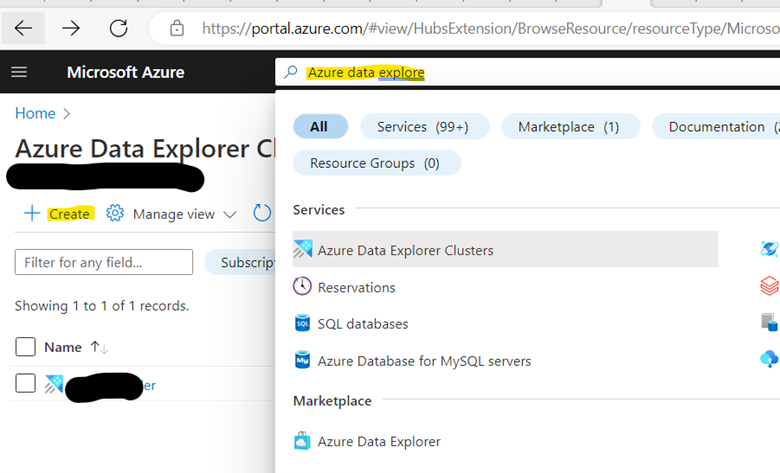
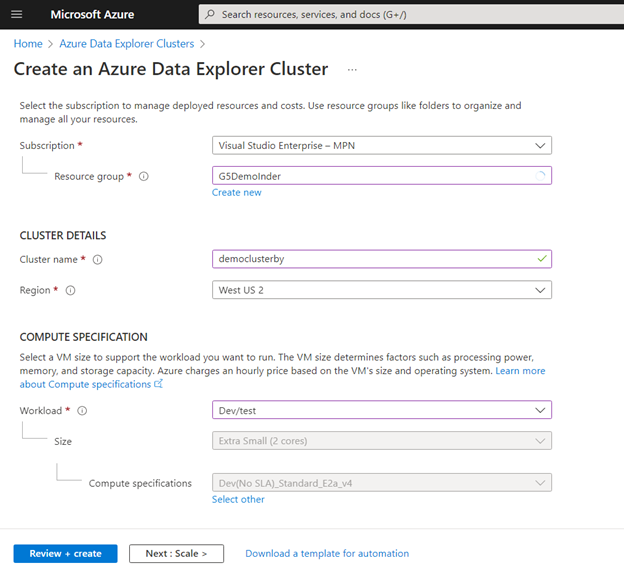
*Create a new resource group if required.
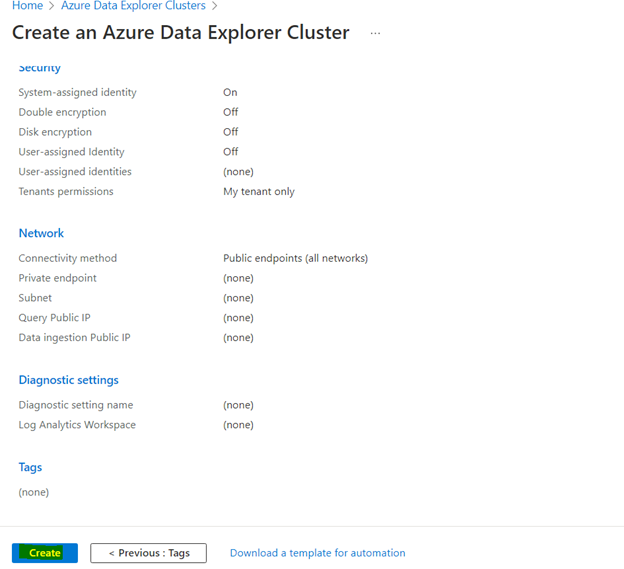
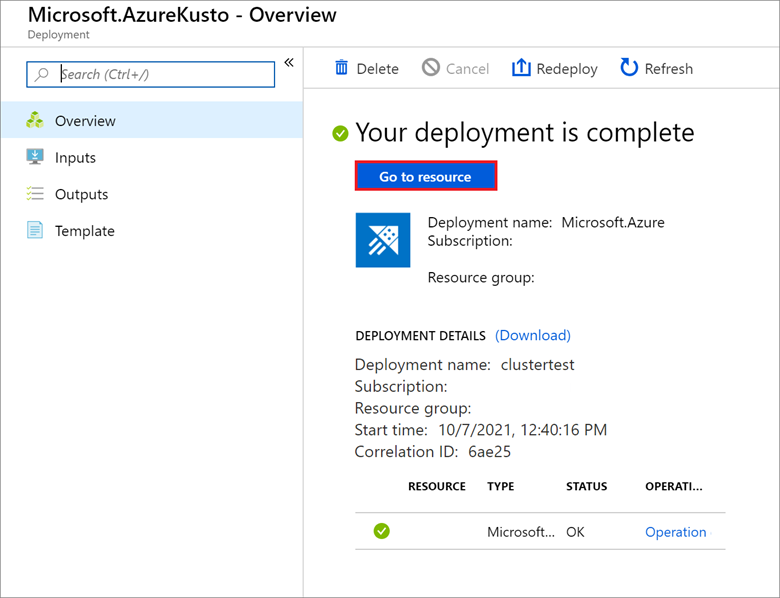
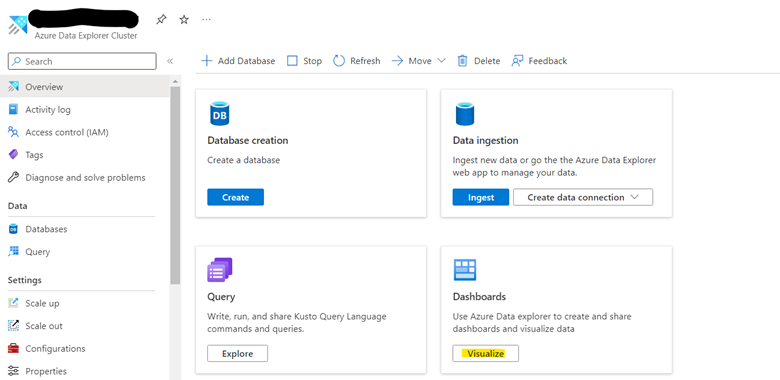
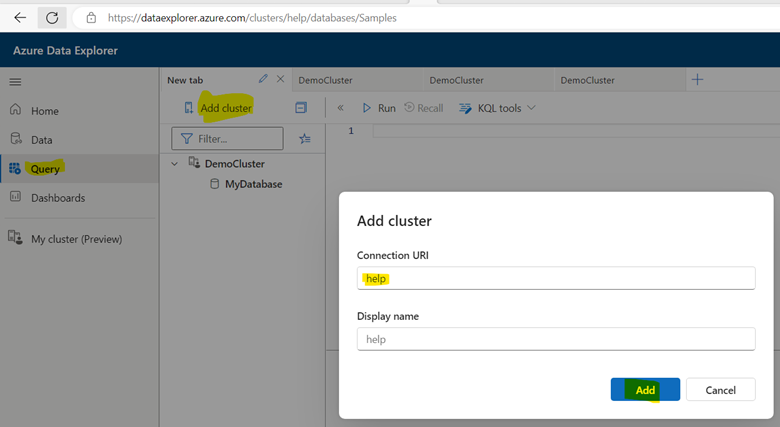
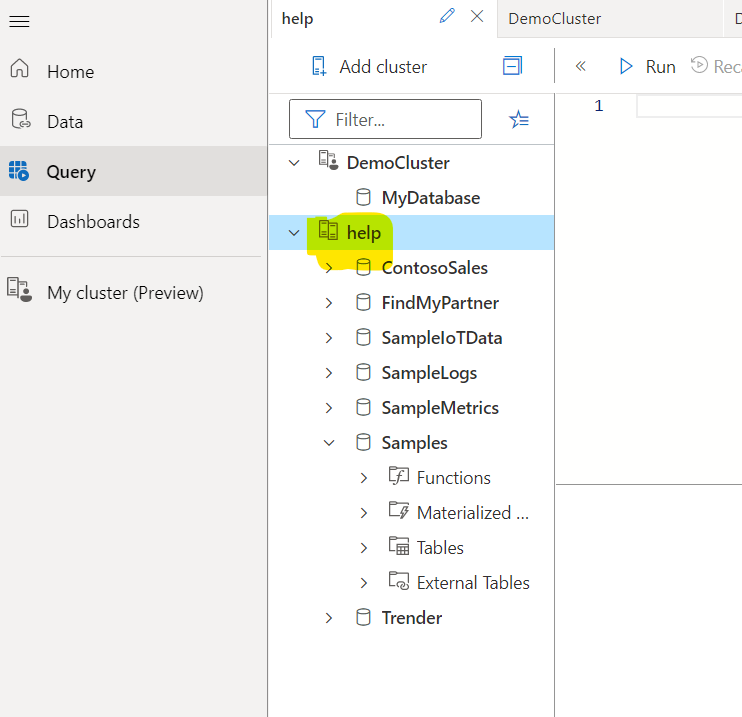
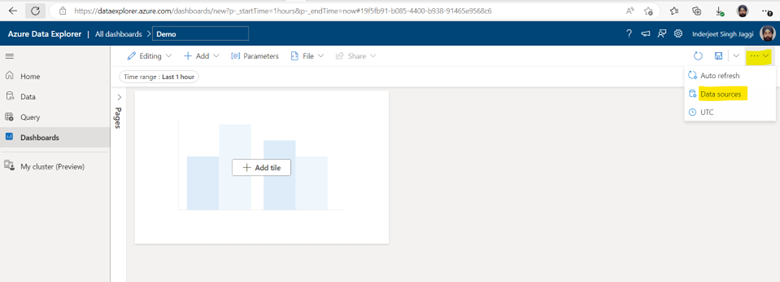
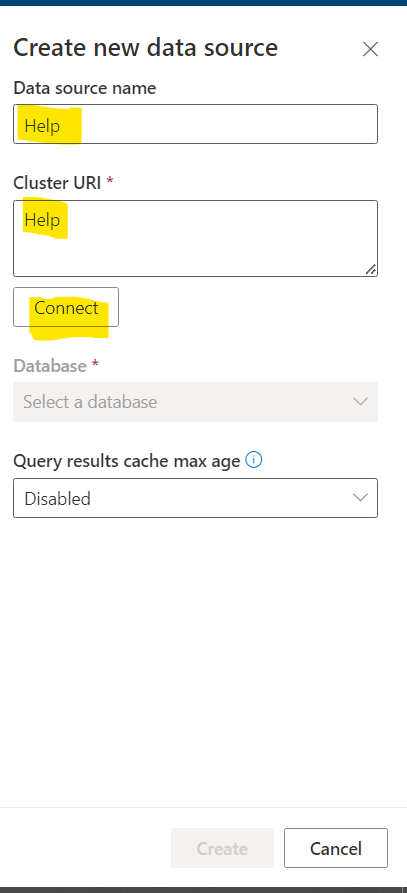
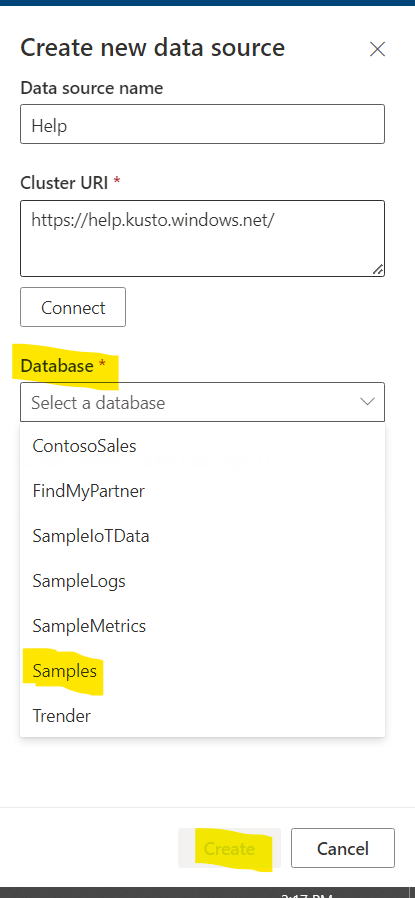
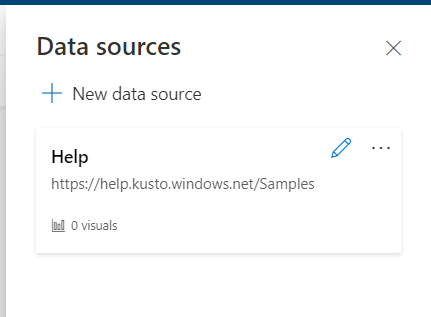
2. Add Help database to Visualization Dashboard
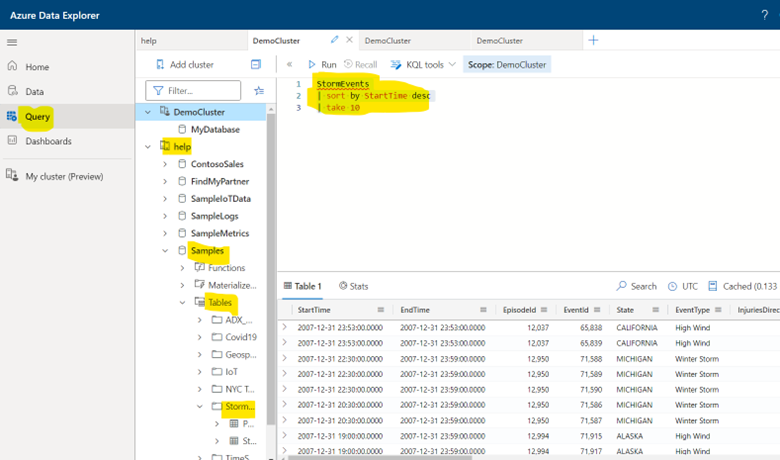
StormEvents
| sort by StartTime desc
| take 10
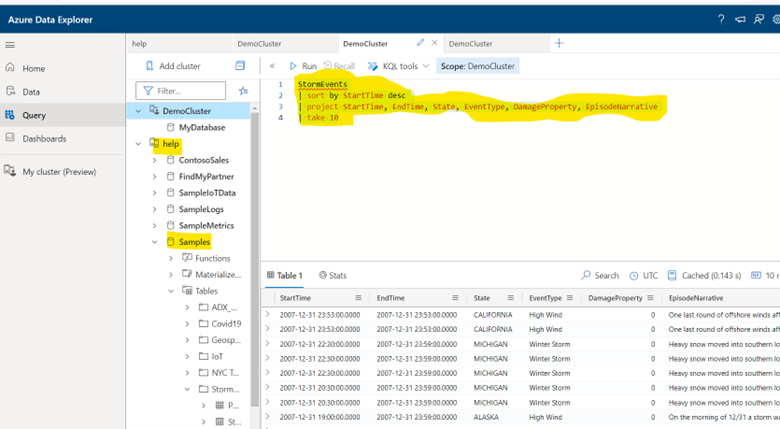
StormEvents
| sort by StartTime desc
| project StartTime, EndTime, State, EventType, DamageProperty, EpisodeNarrative
| take 10
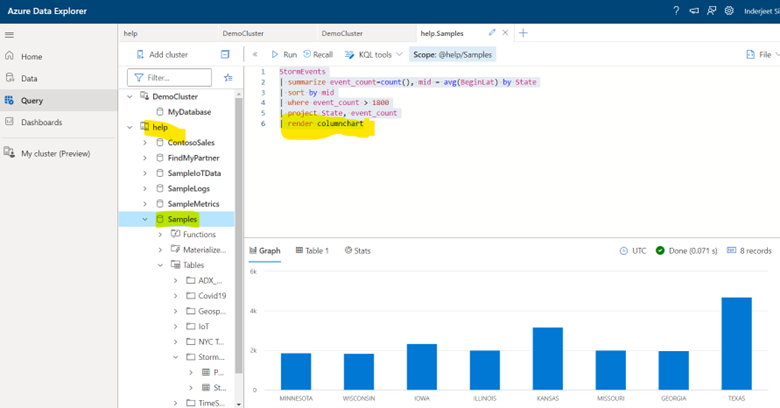
StormEvents
| summarize event_count=count(), mid = avg(BeginLat) by State
| sort by mid
| where event_count > 1800
| project State, event_count
| render columnchart
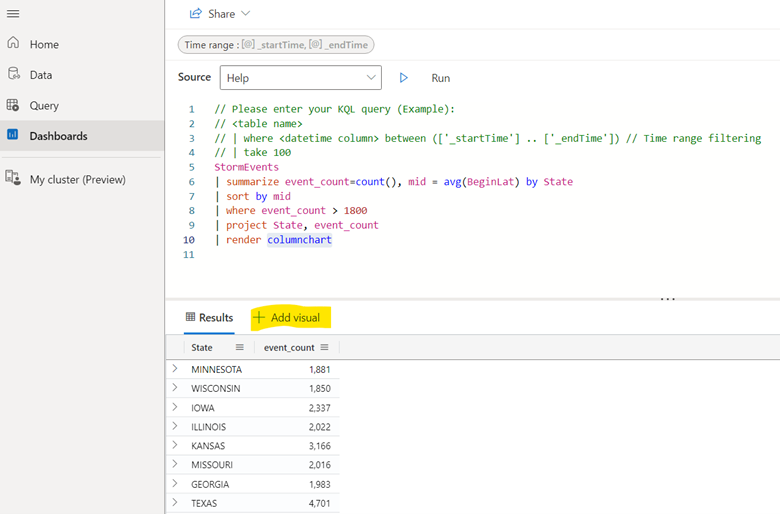
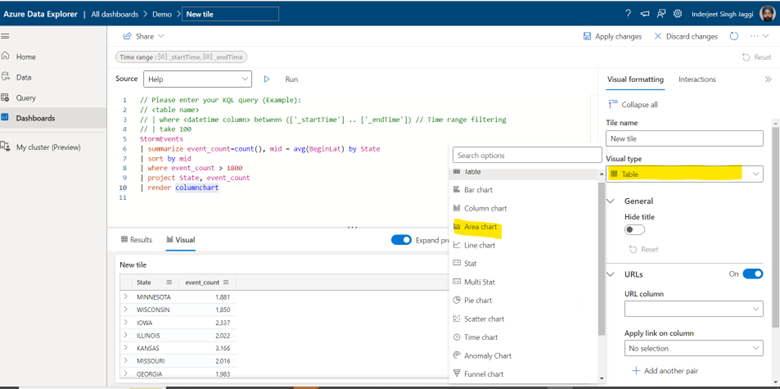
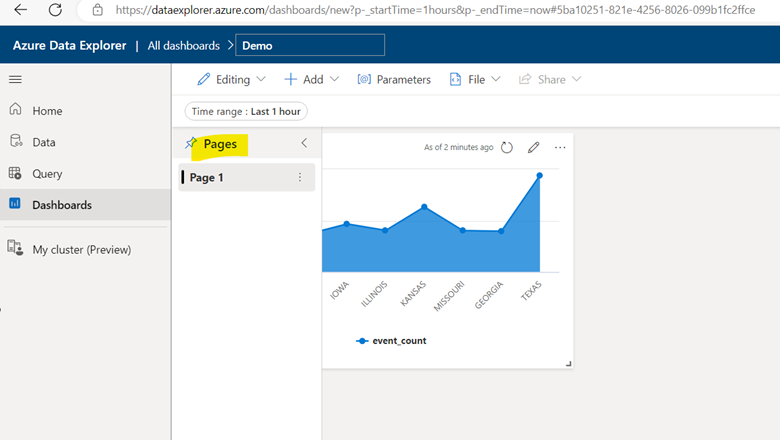
3. Finally we are ready to create Visualization Dashboard
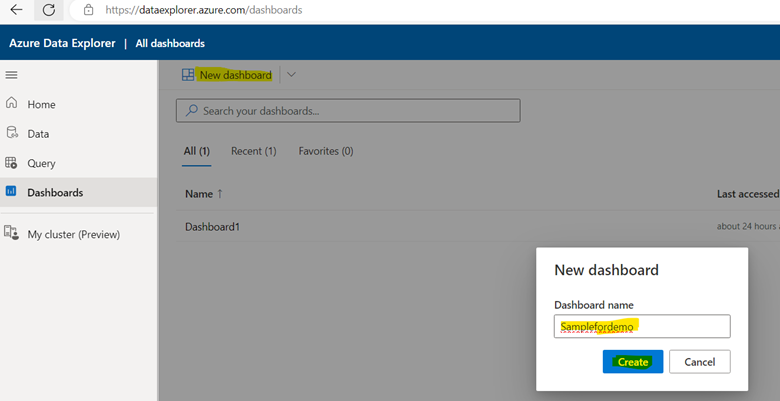

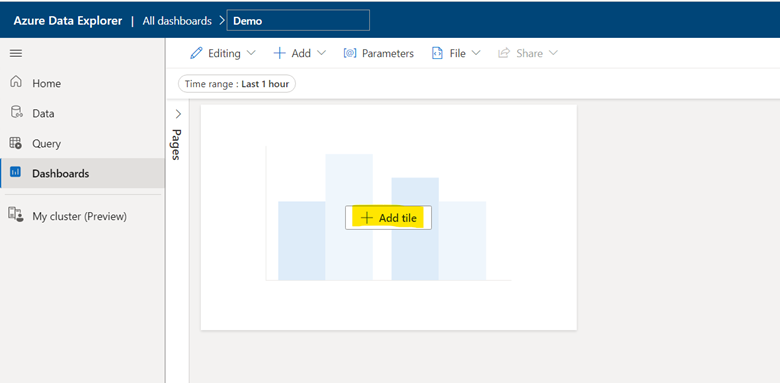
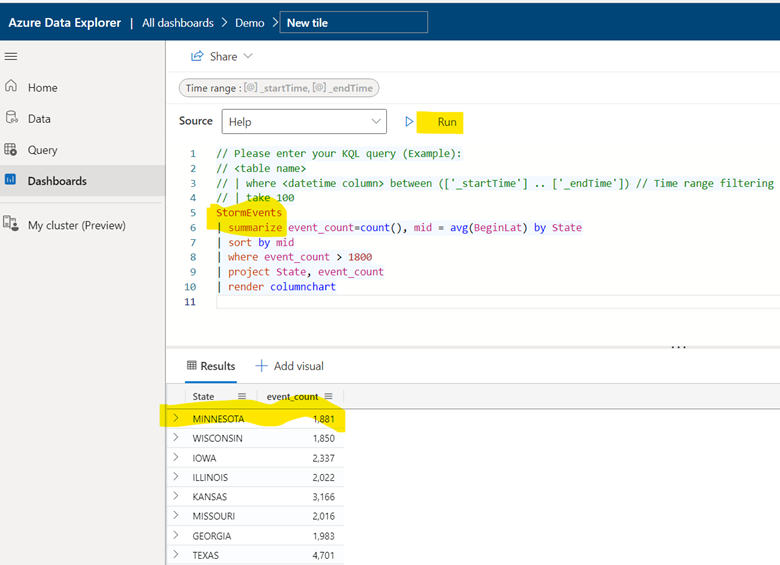
StormEvents
| summarize event_count=count(), mid = avg(BeginLat) by State
| sort by mid
| where event_count > 1800
| project State, event_count
| render columnchart
Onboard External GCCHigh or commercial User to commercial AD tenant
- Add users as External User in Azure AD. If You are adding a GCC or GCChigh user, you need to follow step 11 before you start step 1.


11. For GCCHigh, below tenant level setting is additionally needed before you follow step 1


- Once added, click on ‘Inherited from default’

- Select ‘Customize Settings’ for B2B collaboration > ‘Allow access’ under external users and group. Set ‘Allow access’ under Applications

- Select ‘Customize Settings’ for B2B Direct Connect > ‘Allow access’ under external users and group. Set ‘Allow access’ under Applications

- Under Microsoft cloud settings select ‘Microsoft Azure Government’

- Now from GCCHigh, go to Access Poratl.azure.com, search Azure Active Directory > ‘External Identities’ from left navigation > Add the GCCHigh tenant ID and then select Add at bottom.


- For GCCHigh we should leave ‘Inherited from default’

- Under Microsoft cloud settings select ‘Microsoft Azure Commercial’

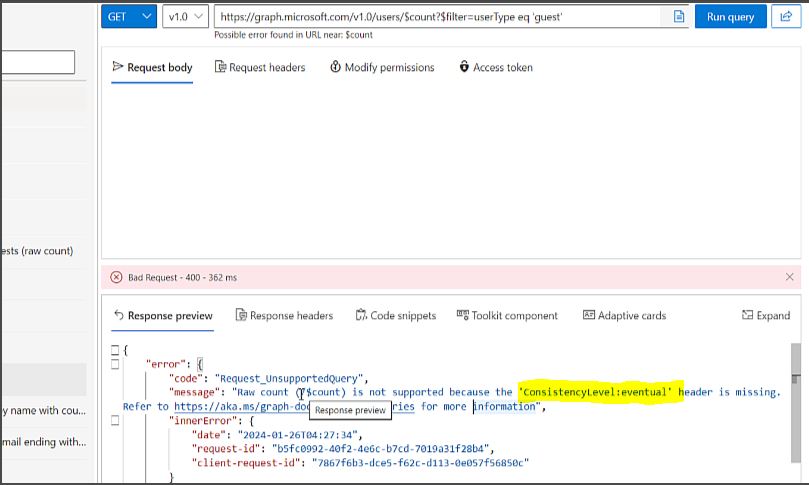
ConsistencyLevel:eventualError when using graphs API ‘count the guest users in your organization’
Classic application insights will be retired on 29 February 2024—migrate to workspace-based application insights
I recently got a email which says ‘Classic application insights will be retired on 29 February 2024—migrate to workspace-based application insights’.
Further it adds, classic application insights in Azure Monitor will be retired and you’ll need to migrate your resources to workspace-based application insights by that date.
Now if we move to Workspace-based application insights, it will offer improved functionality such as:
- Continuous export of app logs via diagnostic settings.
- The ability to collect data from multiple resources in a single Azure Monitor log analytics workspace.
- Enhanced encryption and optimization with a dedicated cluster.
- New options to reduce costs.
Now let’s logon to Azure and check what it means and how to migrate to workspace-based application insights.
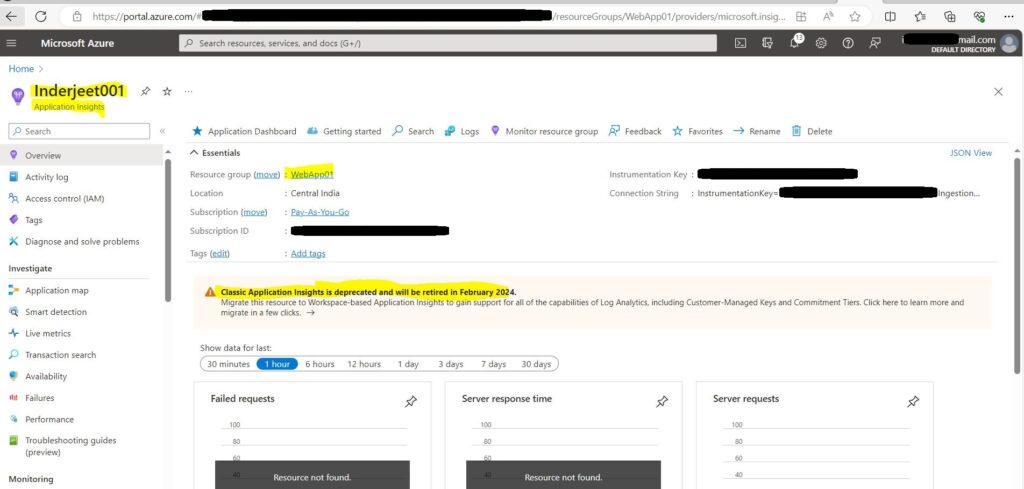
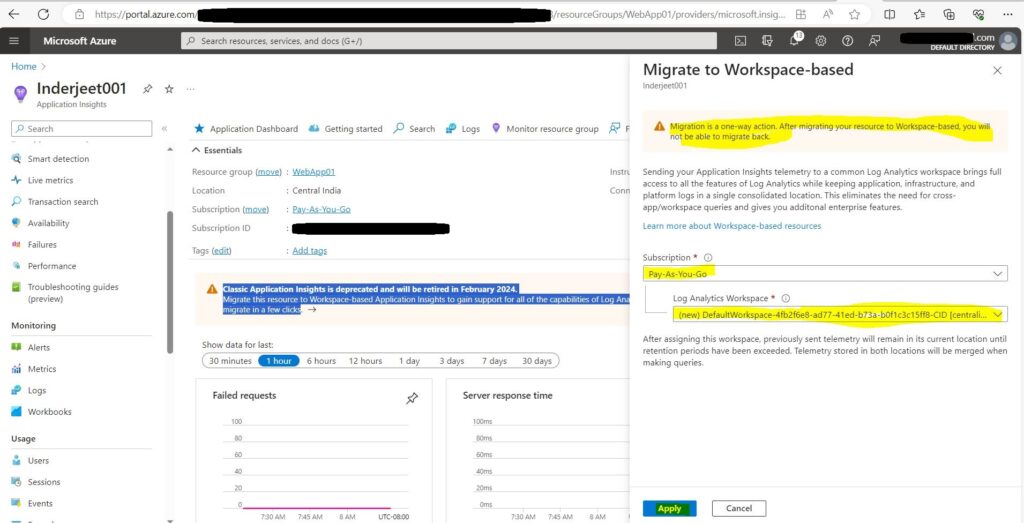
Access the Application Insights and then click on ‘Classic Application Insights is deprecated and will be retired in February 2024. Migrate this resource to Workspace-based Application Insights to gain support for all of the capabilities of Log Analytics, including Customer-Managed Keys and Commitment Tiers. Click here to learn more and migrate in a few clicks’.
Now you will see the Subscription and the new Log Analytics Workspace getting created. Just click Apply at bottom of screen.
Once done, you will see the new workspace created and all the content of classic application.
You can also watch the whole process in my Youtube Video
https://www.youtube.com/watch?v=gvQp_33ezqg
Estimating Physical Resources in Quantum Computing with Microsoft Azure
Resource estimation is a vital aspect in the realm of quantum computing. Microsoft Azure offers a sophisticated tool known as the Azure Quantum Resource Estimator to facilitate this critical process. Resource estimation plays a crucial role in evaluating the computational needs of quantum algorithms and optimizing computing resource usage. Leveraging the Azure Quantum Resource Estimator empowers users to gain insightful understanding of the computational demands of quantum algorithms, enabling informed decision-making about resource allocation. This tool assists in fine-tuning resource utilization, ultimately improving the efficiency and performance of quantum computing tasks.
The Importance of Resource Estimation
Quantum computing hinges on resource estimation, a vital process for gauging the requisites of executing a quantum program, encompassing qubit count, quantum circuit depth, and quantum operation tally.
Estimating these resources is crucial for several reasons:
- By treading the path of resource estimation, quantum programmers can meticulously craft efficient codes, tuning the allocation of resources, and streamlining their utilization.
- Resource estimation also elucidates the feasibility quotient pertaining to quantum operations vis-à-vis different quantum hardware, helping decipher the viability of executing specific quantum programs.
- Considering the lofty expenses endemic to quantum computing, resource estimation assumes a pivotal role in fiscal governance, furnishing an empirical basis for prognosticating the costs entailed in running quantum programs.
Using the Azure Quantum Resource Estimator
The Azure Quantum Resource Estimator is a tool provided by Microsoft Azure that helps in estimating the resources required to run a quantum program. Here’s how you can use it:
- Commencing the quantum odyssey, the initial stride involves scripting the quantum program employing Q#, an avant-garde quantum programming dialect incubated by Microsoft.
- Post-scripting, the foray into resource estimation unfurls, facilitated by the Azure Quantum Resource Estimator, which furnishes an insightful appraisal of the resources indispensable for program execution.
- Subsequently, delving into a comprehensive dissection of the resource estimation outcomes proffered by the Azure Quantum Resource Estimator allows intricate insights, paving the way for nimble program optimization.
Conclusion
Resource estimation galvanizes the bedrock of quantum computing, and with the Azure Quantum Resource Estimator as your compass, you can steer through the uncharted waters of resource quantification, birthing sagacious and cost-effective quantum algorithms.
Interacting with Azure Quantum Cloud Service
The realm of quantum computing is rapidly advancing, and Microsoft Azure stands at the vanguard of this transformative juncture. Through Azure Quantum, you have the capacity to script your quantum algorithms and execute them on bona fide quantum processors. The process unfolds as follows:
Step 1: Writing Your Quantum Programs
Firstly, you compose your quantum algorithms. This is achievable through Q#, an exclusive programming language crafted by Microsoft for articulating quantum computations. Q# is encompassed within the Quantum Development Kit (QDK), comprising an array of open-source utilities that facilitate developers in coding, assessing, and debugging quantum algorithms.
Step 2: Accessing Azure Quantum
Subsequently, upon crafting your quantum algorithms, the next strategic maneuver is to engage with Azure Quantum. This entails steering towards the Azure Quantum website using your web browser. If you don’t possess an Azure account, you’ll be obliged to create one. Once authenticated, you gain entry to the Azure Quantum service.
Step 3: Running Your Quantum Programs
Upon gaining access to Azure Quantum, you can set in motion the execution of your quantum programs on authentic quantum processors. This action entails navigating to the ‘Jobs’ segment within your designated Azure Quantum workspace. Here, you dispatch your quantum programs as jobs earmarked for enactment on the quantum hardware. You are at liberty to select from a diverse pool of quantum hardware providers, guaranteeing that you are endowed with the requisite resources to delve into the potency of quantum computing.
Step 4: Monitoring Your Jobs
Following the submission of your jobs, you are in a position to directly oversee their progression via your Azure Quantum workspace. Azure Quantum furnishes comprehensive insights into each job, encompassing its status, the quantum apparatus upon which it is being executed, and the resultant findings.
Conclusion
Interacting with Azure Quantum Cloud Service is a straightforward process. With just a browser and an Azure account, you can start exploring the exciting world of quantum computing. Whether you’re a seasoned quantum computing professional or a curious beginner, Azure Quantum provides the tools and resources you need to dive into quantum computing.
Quantum Intermediate Representation (QIR) in Azure Quantum
In the realm of quantum computing, the paramount factors are interoperability and hardware independence. Microsoft Azure Quantum attains this by leveraging Quantum Intermediate Representation (QIR), a universal language that ensures compatibility of code across various quantum hardware platforms.
Understanding QIR
Quantum Intermediate Representation (QIR) stands as a hardware-agnostic intermediary representation for quantum programs. Founded upon LLVM, an extensively utilized open-source endeavor, it furnishes a language-agnostic structure for presenting program code in a ubiquitous intermediate language.
QIR in Azure Quantum
Azure Quantum utilizes QIR to target diverse quantum machines. Consequently, developers can craft their quantum program just once and subsequently execute it across varied quantum hardware sans the need for code rewrites. This presents a notable advantage, enabling developers to concentrate on formulating their quantum algorithms without fretting over the specific intricacies of the underlying quantum hardware.
Benefits of QIR
The use of QIR in Azure Quantum has several benefits:
- Hardware Independence: Quantum Intermediate Representation (QIR) facilitates hardware independence, allowing quantum algorithms to be authored once and executed on any quantum processor compatible with QIR’s specifications.
- Interoperability: QIR fosters seamless interoperability across diverse quantum programming languages, streamlining collaboration among developers and facilitating the exchange of code.
- Optimization: QIR empowers the implementation of sophisticated optimization methodologies, enhancing the efficiency and efficacy of quantum algorithms.
Conclusion
Employing Quantum Intermediate Representation (QIR) within Azure Quantum constitutes a pivotal advancement in the realm of quantum computing. QIR guarantees seamless code compatibility across diverse quantum hardware, fostering interoperability and emancipating it from hardware constraints. Consequently, developers can channel their energy towards the quintessential task: crafting potent and efficacious quantum algorithms.

