Who's Online
1 visitors online now
0 guests, 1 bots, 0 members
Support my Sponsor
  • An error has occurred, which probably means the feed is down. Try again later.

Archive for February, 2023

What is digital twin? – Part 2

Now lets understand when you should use Digital twin:

  1. You should use it when you have large number of digital twin to manage
  2. When there is complexity in relationship
  3. It would be best if you can existing model instead of creating new once
  4. You can benefit if it has flexible schema

Couple of things which popularized digital twin in recent days:

  1. Cheap IOT devices
  2. Increased number of IOT devices in use
  3. Affordable internet/connectivity
  4. Boost in Cloud platforms

If you want to implement Digital Twin, you need to make sure your projects have below characteristics:

  1. Ability to establish some sort of connection between 2 devices
  2. Can and should require queries to be executed based on device parameters
  3. Secure integration

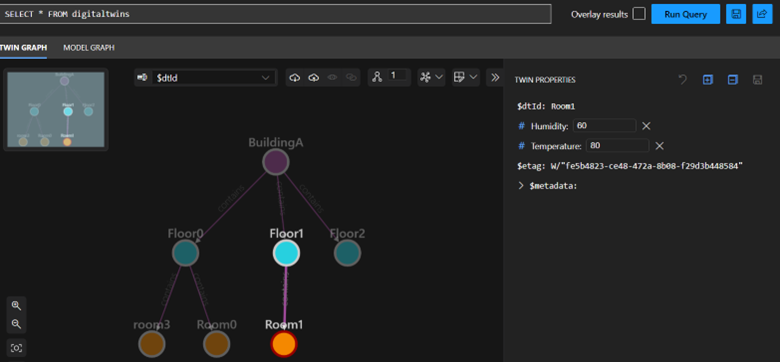
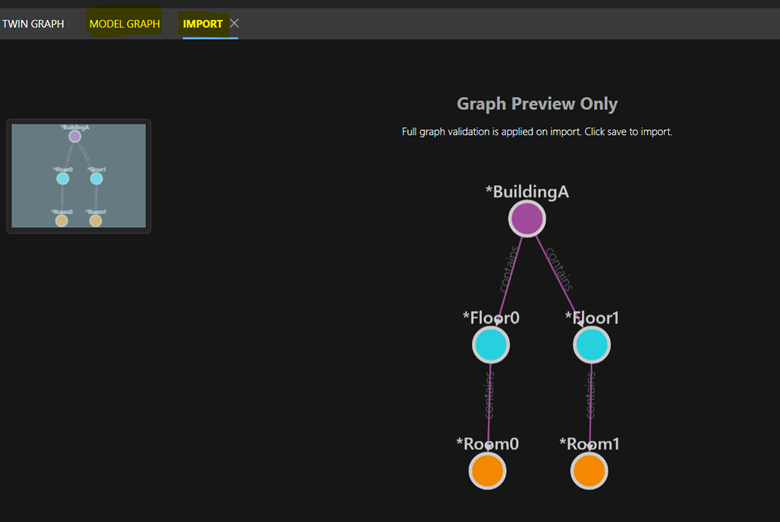
Lets try to build a Digital twin of a Building to understand what is temperature of each room.

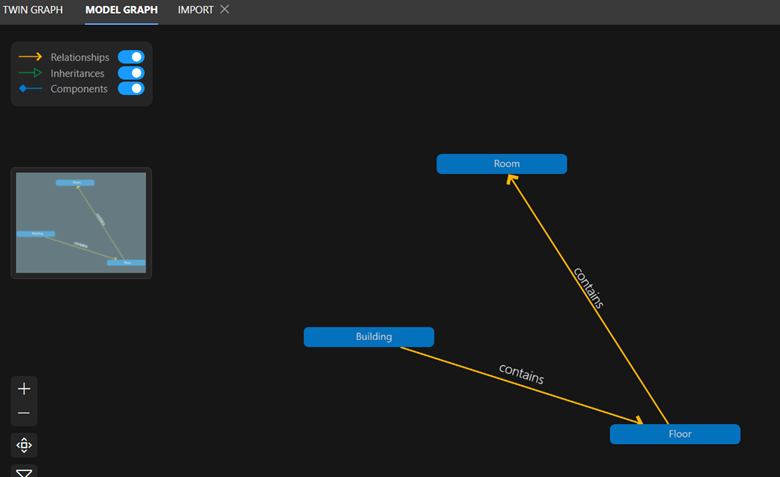
In Azure Digital Twin, we have 4 types of interfaces or classes

  1. Component – Temperature and humidity
  2. Relationship – Building has floor and then floor has rooms
  3. Telemetry – Input data
  4. Properties – State of entity

You can download the json from MS link below:
Building  : https://raw.githubusercontent.com/Azure-Samples/digital-twins-explorer/main/client/examples/Building.json
Floor : https://raw.githubusercontent.com/Azure-Samples/digital-twins-explorer/main/client/examples/Floor.json
Room : https://raw.githubusercontent.com/Azure-Samples/digital-twins-explorer/main/client/examples/Room.json

Below is 1st look of ADT with a building, Floor and room.
Building model
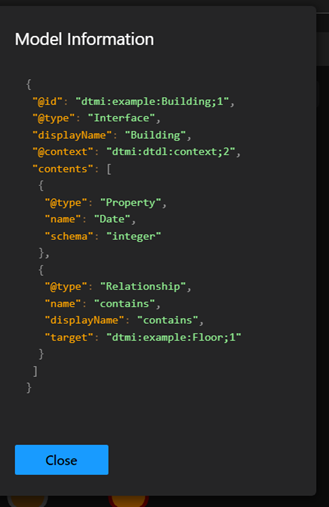
Here Json needs to start with dtmi with displayname as ‘Building’, next the only property of this interface is Date, It has relationship with Floor. Most important is DisplayName.
Floor
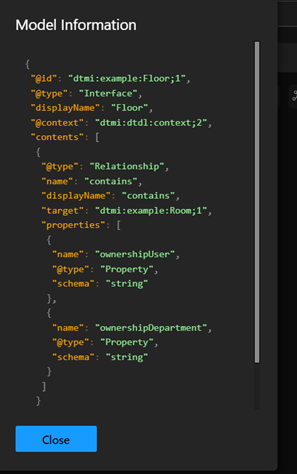
Here Json needs to start with dtmi with displayname as ‘Floor’, next properties of this interface is OwnershipUser and OwnershipDeparment, It has relationship with Room
Room
Here Json needs to start with dtmi with displayname as ‘Room, next the only property of this interface is Temperature and Humidity, It has no further relationship

Make sure you use DTDL validator while creating these Json files
https://learn.microsoft.com/en-us/samples/azure-samples/dtdl-validator/dtdl-validator/

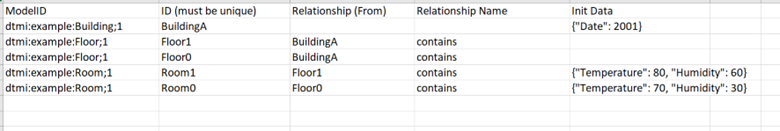
Using this json we have multiple ways to create our scenario’s but we will use below xlsx file which has specified data to start with. You can download the excel for building scenario’s from below path:
https://github.com/Azure-Samples/digital-twins-explorer/raw/main/client/examples/buildingScenario.xlsx

Here is how it looks like which has model ID, ID, Relationship, etc. Most excel will have these 5 fields for any model
After the import, this is what you will see and you can check Model Graph as well. Process to import the Json and excel will be part of next article

Microsoft understands it will take a lot of efforts for one to create these models and relationships, so to ease the process Microsoft has published a few models such as space, event, document, building, etc so you can reuse them as your start point

https://github.com/WillowInc/opendigitaltwins-building

Here is basic strcture of Azure Digital Twin

Here is basic strcture of Azure Digital Twin:

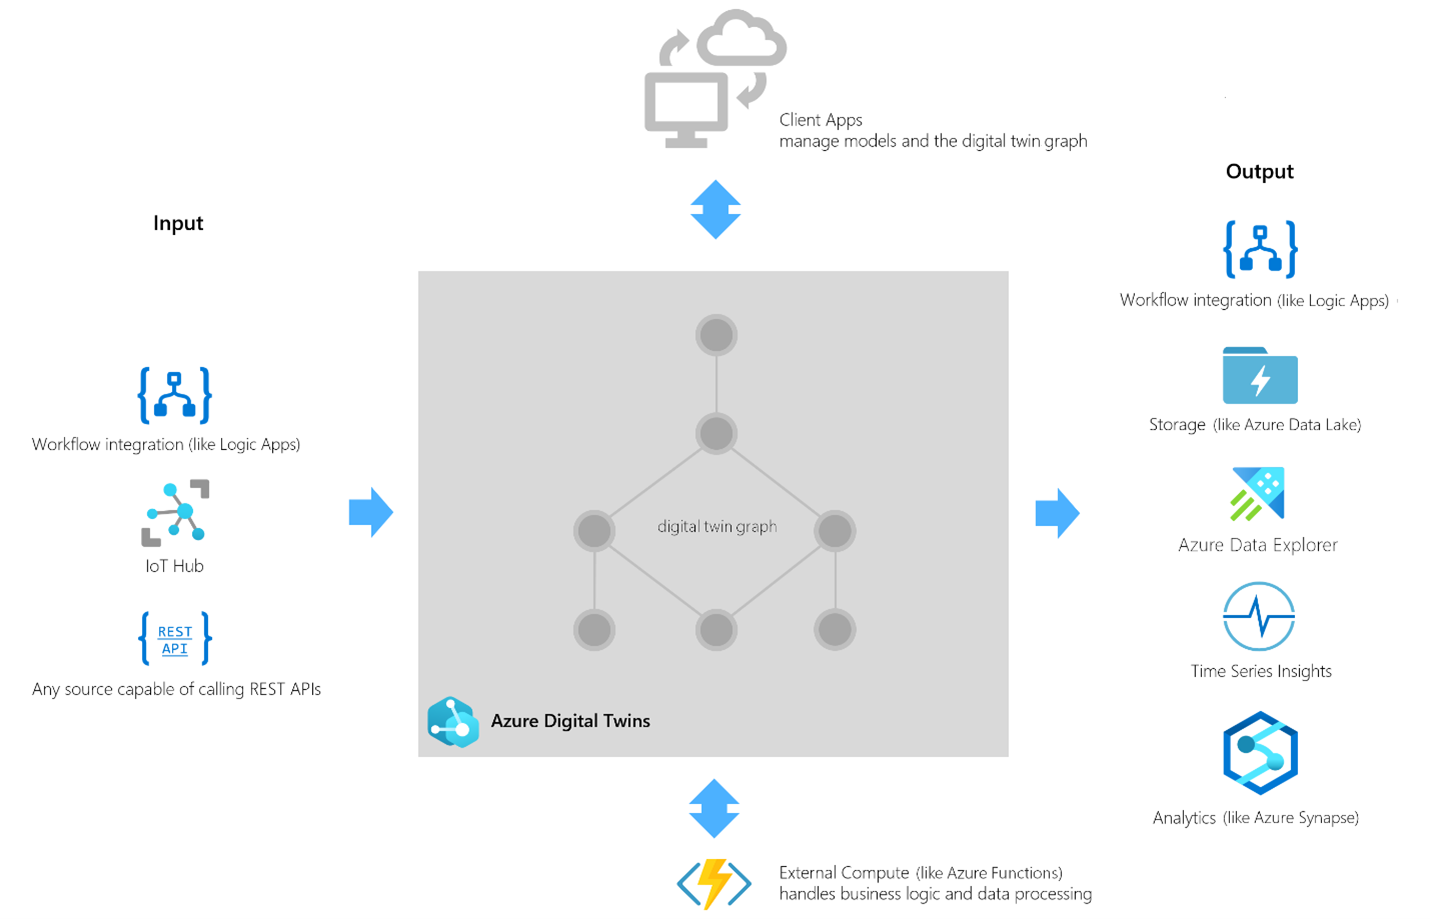
Input : Input can be from Workflows, IOT hub or any rest Api. You can input parameter data manually as well.
Processing : Azure Digital Twin platform process the input based on business logics, understands connections and process data accordingly. Digital twin of real-world sensors can be created to predict and test results based on change in inputs
Output : Using Time Series insights, Azure data explorer and Analytics we can better visualize data and actionable items can be driven from predictions.

Main challenges with ADT are:

  1. Modelling is difficult and time consuming
  2. Delay in processing data realtime
  3. Inter operability between different types of IOT devices and services
  4. Hard and expensive for existing systems
  5. Privacy and confidentiality

ChatGPT is back with new Avatar, Try new Bing

If you are looking for a new way to search the web, you should check out the new Bing. The new Bing is more than just a search engine. It’s a chat partner that can answer your questions, provide complete information and even inspire your creativity.

The new Bing uses ChatGPT AI technology to give you better results for simple things like sports scores, stock prices and weather . But it also shows you more detailed answers if you want them . You can chat with Bing in natural language, do complex searches, follow up and make refinements. You’ll be surprised by how well Bing understands you and responds to your needs.

But that’s not all. The new Bing also helps you unleash your creative potential with features like poems, stories, code, essays, songs and celebrity parodies. You can ask Bing to create any of these for you based on your keywords or preferences. You can also edit and share them with others.

The new Bing also works seamlessly with Microsoft Edge, your copilot for the web. Edge gives you access to exclusive features like Collections, Immersive Reader and Vertical Tabs that help you organize your browsing experience. You can also sync your bookmarks, passwords and settings across devices with Edge.

Don’t miss out on the new Bing. Go to bing.com/new and start exploring the possibilities. The new Bing is here to help you find what you need and have fun along the way.

What is digital twin? – Part 1

What is digital twin?
Virtual representation of real world item or process.

Digital twin platform enables us to actually collect this data, process it, provide insights and then enable us to take some actions based on the data. More specifically take proactive measures instead of reactive measures. General its used for items but we can also use it for processes. I will explain on how we can use digital twin for processes.

What are types of Twin?

  1. Digital Model/Simulator: Here we manually feed data into a existing model to see its results. If we have seen the movie ‘Day After Tomorrow’, the scientist inputs data from various locations in the existing model and can predict what the world would go through in next few days.  
  2. Digital Shadow: Here real world devices/sensors send IOT data to virtual platform. Lets assume we have a physical car and a wheels in your car has a sensor wheel which is sending data to the a cloud based digital twin wheel (Virtual representation of car). This will help understand when your car tires needs to be replaced or repaired. A real life example is Michelin Fleet Solutions.
  3. Digital Twin: Here we have 2 way data sync from sensor to the digital twin and may receive some action based on input provided. Example here is where we have a multistory warehouse which has sensor on all most critical components, water supply, electricity circuit, elevators, co2 level, AC etc. Based on feedback of the sensors, temperature(Cold storage) in one section of the warehouse is different and other section(Meeting room).


Typical Digital Twin functions

  1. Visualize current state of item or process
  2. Trigger alerts under certain conditions
  3. Review historic data
  4. Simulate scenarios

Few Benefits:

  • Helps save money incase we go live/production with a major defects or avoid downtime at all.
  • Learn from past scenarios.
  • Help increase safer work environment.
  • Increase Quality / efficiency / life of the products/organization.


How are digital twin used in real world?

As I have already shared, Michelin Fleet Solutions now sells kilometers instead of tyres to make profit and sensor in wheel of car is sending data to the a cloud based digital twin wheel (Virtual representation of car).This will help understand when your car tires needs to be replaced or repaired. Also they provide feedback to customer on which routes to take and what time to travel to avoid reduce lifespan of the wheels.

Another example is where a supermarket monitors all the customers as to which section they visit most, which is most visible section for adds, how many people buy what kind of items from check out counters, etc. This helps them to place new products / high margin products in that area with high footprint and also plan a longer exit path so because physiologically, the more time a person spends in the store, the more he would purchase.

Origins of digital twin
John Vickers who was Principal technologies invented the word digital twin back in 2010.
Michael Grieves then worked with Vickers to create digital twin of few real life items. It got boost after IOT growth accelerated.

One of the best example is Digital Twin Victoria(Australia)

Permission or URL issue when you use Azure Digital Twin explorer for the 1st time

When you open digital twin for the 1st time, you will have to provide the Azure digital twins URL.
This is the URL from your Digital Twin Overview screen in front of Hostname as shown below, make sure you start with https://
If you get below error or any permission error try below steps to resolve the issue
Error : ‘Double check URL and directory’ or ‘you don’t have permission on the Digital twin URL’
RestError: Sub-domain not found.
    at new t (https://explorer.digitaltwins.azure.net/static/js/465.196a83e5.chunk.js:2:21103219)
    at https://explorer.digitaltwins.azure.net/static/js/465.196a83e5.chunk.js:2:21108505
    at https://explorer.digitaltwins.azure.net/static/js/465.196a83e5.chunk.js:2:21109190

To resolved these errors follow below steps

  • In the Azure portal, navigate to the Digital Twins resource
  • Make sure you use the URL given on your Digital Twin Overview screen in front of Hostname as shown above, make sure you start with https://
  • Also give appropriate permission to yourself by clicking on the Access Control (IAM) menu
  • Select Add role assignment
  • Select Azure Digital Twins Data Owner in the Role dropdown listbox
  • For the Assign access to setting, select User, group, or service principal
  • Now, select the user that you are using in the Azure portal right now and that you’ll use on your local machine to authenticate with the sample application
  • Click Save to assign the Role

Quick overview of Azure Data Explorer

A big data analytics platform called Azure Data Explorer makes it simple to quickly evaluate large amounts of data. You may get a complete end-to-end solution for data ingestion, query, visualization, and administration with the Azure Data Explorer toolset.

Azure Data Explorer makes it simple to extract critical insights, identify patterns and trends, and develop forecasting models by analyzing structured, semi-structured, and unstructured data over time series. Azure Data Explorer is helpful for log analytics, time series analytics, IoT, and general-purpose exploratory analytics. It is completely managed, scalable, secure, resilient, and enterprise ready.

Terabytes of data may be ingested by Azure Data Explorer in minutes in batch or streaming mode, and petabytes of data can be searched with millisecond response times. Data can be ingested in a variety of structures and formats. It may enter from a number of channels and sources.

The Kusto Query Language (KQL), an open-source language created by the team, is used by Azure Data Explorer. The language is straightforward to comprehend and learn, and it is quite effective. Both basic operators and sophisticated analyses are available. Microsoft makes extensive use of it (Azure Monitor – Log Analytics and Application Insights, Microsoft Sentinel, and Microsoft 365 Defender). KQL is designed with quick, varied big data exploration in mind. queries any other tabular expressions, including views, functions, and tables. This can involve clusters or even tables from various databases.

Each table’s data is kept as data shards, commonly referred to as “extents.” Based on the ingestion time, all data is automatically indexed and partitioned. There are no main foreign key requirements or other restrictions, like as uniqueness, unlike a relational database. As a result, you may store a wide variety of data and quickly query it thanks to the way it is kept.

Azure Data Explorer

ADX Dashboards is a newly released feature from Microsoft which provide the ability to create various types of data visualizations in one place and in an easy-to-digest form. Dashboards can be shared broadly and allow multiple stakeholders to view dynamic, real time, fresh data while easily interacting with it to gain desired insights. With ADX Dashboards, you can build a dashboard, share it with others, and empower them to continue their data exploration journey. You can say, this is a cheap alternative to PowerBI.

  1. Create Azure data explorer cluster
a. Browse portal.azure.com, search for Azure Data explorer cluster > Click Create
b. Provide the required details such as resource group, clustername, region. Make sure for workload you select dev\test for dev only, if you are going to create a prod group select compute optimze.
*Create a new resource group if required.
c. Once done, Review the details and select ‘Create’
d. Resource creation will take time. In my case it took about 20 mins. Once created click on ‘Go to resource’
Next we have to create a new database, but in our case we will use existing database provided by MS for our demo. If you wish you interest your own data, click on ‘Create’ under database creation.

2. Add Help database to Visualization Dashboard

a. To create a visualization dashboard either you can browse URL (https://dataexplorer.azure.com/dashboards) or you can click on ‘Visualize’ under Dashboard on the Explorer screen.
b. Once you are on the Azure Data Explorer, we will import a demo data from MS. For that click on Query from left navigation > Add cluster > in the connection URI type Help and click ADD
c. You should see a new Help database is added to the screen
d. You can run few queries to confirm you are getting proper details and result on this screen. I will use strom database with below queries:
StormEvents
| sort by StartTime desc
| take 10
e. Another sample query we can try is
StormEvents
| sort by StartTime desc
| project StartTime, EndTime, State, EventType, DamageProperty, EpisodeNarrative
| take 10
f. In this example I used render as columnchart
StormEvents
| summarize event_count=count(), mid = avg(BeginLat) by State
| sort by mid
| where event_count > 1800
| project State, event_count
| render columnchart

3. Finally we are ready to create Visualization Dashboard

a. Now we are ready to create Dashboards, select Dashboards > Select ‘New Dashboard’, provide a name such as ‘Samplefordemo’ and select ‘create’
b. Once a Dashboards screens is created, we will have to use our database connection from right navigation. Click on 3 dots on right and then select Data sources.
c. Select ‘New data source’ option
d. Type the name of database > in Cluster URI type ‘Help’ and then select ‘Connect’
e. Once connected, we will be able to see all the databases, we need to select Samples database we tested above and select create at bottom of screen
f. Now we should see the samples added to the dashboard so we can cancel this screen.
g. Now on home screen, we need to click on Add title.
h. Here we can type the query for the database and select RUN. We should see some data at the bottom of the screen.
StormEvents
| summarize event_count=count(), mid = avg(BeginLat) by State
| sort by mid
| where event_count > 1800
| project State, event_count
| render columnchart
i. Now select ‘+ add Visual’
j. Select any of the option from visual type and you can make many more changes as per chart selected. Once done, select Apply Changes.
k. Your Dashboard is now ready and can be saved and shared with your colleagues. You can add more charts to this page by select Add on top.
If all your charts don’t fit to this screen or you want to segerate them you can create pages based on department and teams.

Onboard External GCCHigh or commercial User to commercial AD tenant

  1. Add users as External User in Azure AD. If You are adding a GCC or GCChigh user, you need to follow step 11 before you start step 1.
1. Access Poratl.azure.com, search Azure Active Directory > Users > New User > Invite External User
2. Keep ‘Invite User’ option selected, and enter below details. Make sure location is selected as United States, Select Invite
3. Once the invited user receive below email. User need to select Accept Invitation
4. Accept the below message so tenant can access below information
5. Select Next on below screen to add multi factor authentication for the account, then you can use
6. I selected ‘I want to set up a different Method’ and then selected phone, User can select App as well and proceed.
7. You should get a prompt as, Verified
8. Now if user is added successfully, he will be redirected to URL (My Apps (microsoft.com)
9. Normal users you will see Identity as ‘ExternalAzureAD’ but for GCCHIgh user you will see “ExternalAzureADGovernment”
10. If Projects or any other license is required, make sure you assign the license for same by going to Licenses > Assignments > Select the License and then select Save

11. For GCCHigh, below tenant level setting is additionally needed before you follow step 1

  • Once added, click on ‘Inherited from default’
  • Select ‘Customize Settings’ for B2B collaboration > ‘Allow access’ under external users and group. Set ‘Allow access’ under Applications
  • Select ‘Customize Settings’ for B2B Direct Connect > ‘Allow access’ under external users and group. Set ‘Allow access’ under Applications
  • Under Microsoft cloud settings select ‘Microsoft Azure Government’
  • Now from GCCHigh, go to Access Poratl.azure.com, search Azure Active Directory > ‘External Identities’ from left navigation > Add the GCCHigh tenant ID and then select Add at bottom.
  • For GCCHigh we should leave ‘Inherited from default’
  • Under Microsoft cloud settings select ‘Microsoft Azure Commercial’