ADX Dashboards is a newly released feature from Microsoft which provide the ability to create various types of data visualizations in one place and in an easy-to-digest form. Dashboards can be shared broadly and allow multiple stakeholders to view dynamic, real time, fresh data while easily interacting with it to gain desired insights. With ADX Dashboards, you can build a dashboard, share it with others, and empower them to continue their data exploration journey. You can say, this is a cheap alternative to PowerBI.
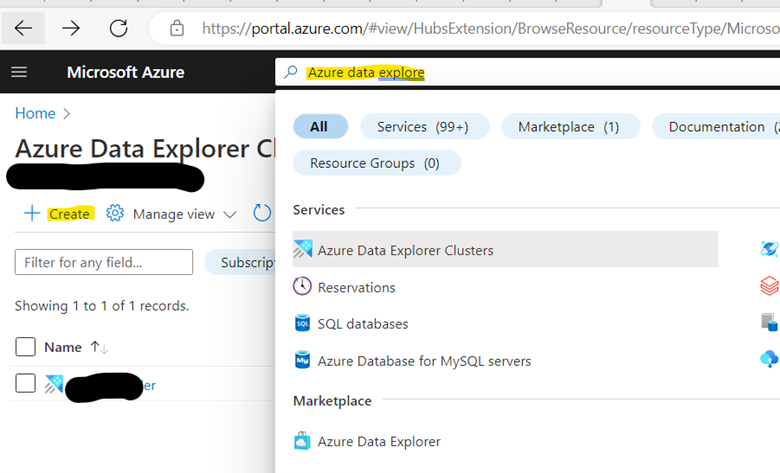
Create Azure data explorer cluster
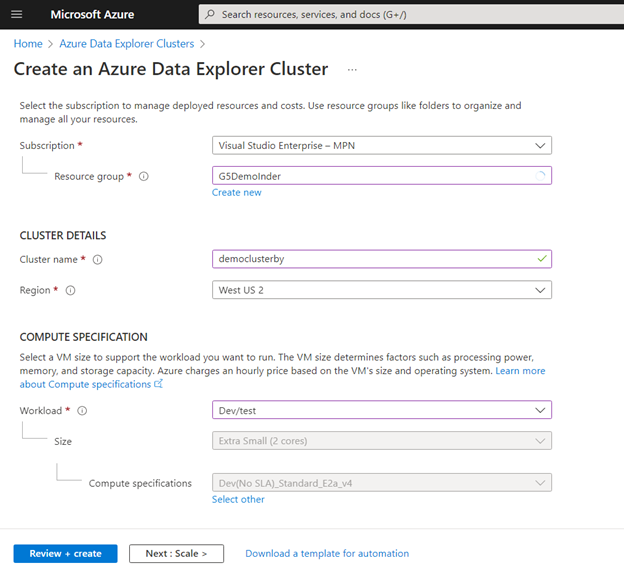
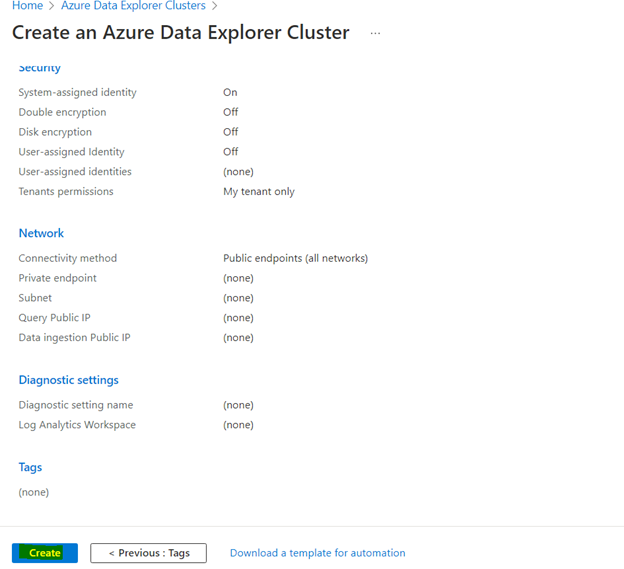
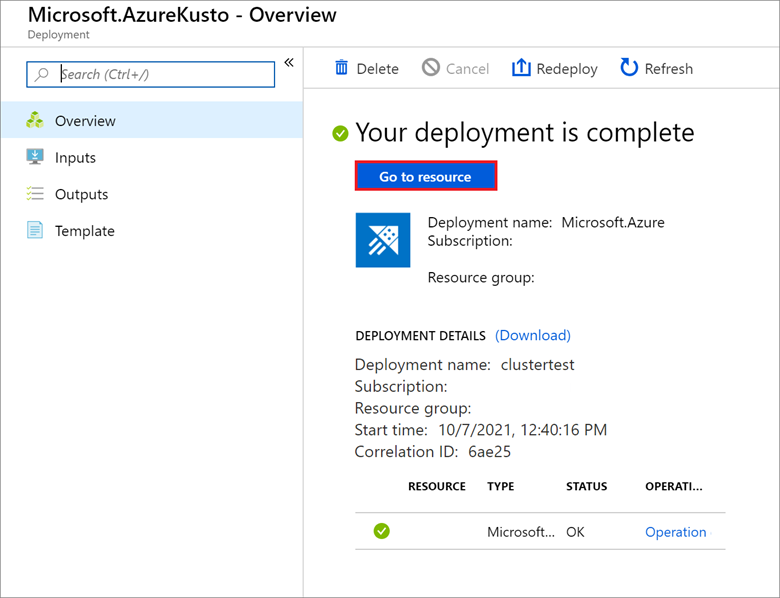
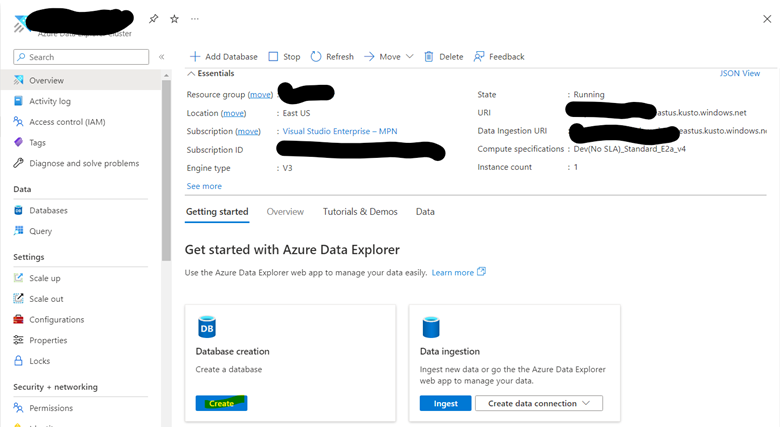
a. Browse portal.azure.com, search for Azure Data explorer cluster > Click Createb. Provide the required details such as resource group, clustername, region. Make sure for workload you select dev\test for dev only, if you are going to create a prod group select compute optimze. *Create a new resource group if required.c. Once done, Review the details and select ‘Create’d. Resource creation will take time. In my case it took about 20 mins. Once created click on ‘Go to resource’Next we have to create a new database, but in our case we will use existing database provided by MS for our demo. If you wish you interest your own data, click on ‘Create’ under database creation.
2. Add Help database to Visualization Dashboard
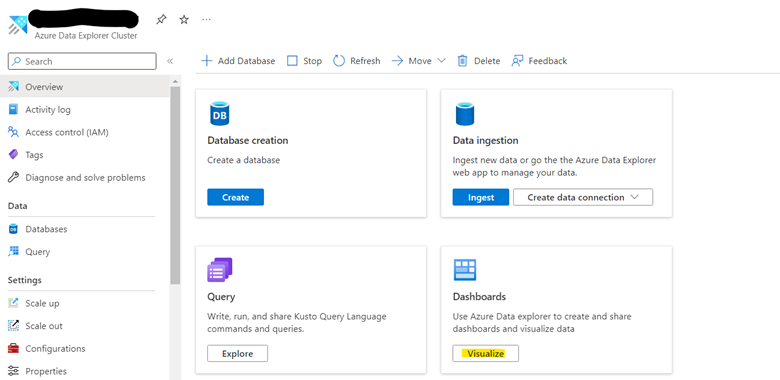
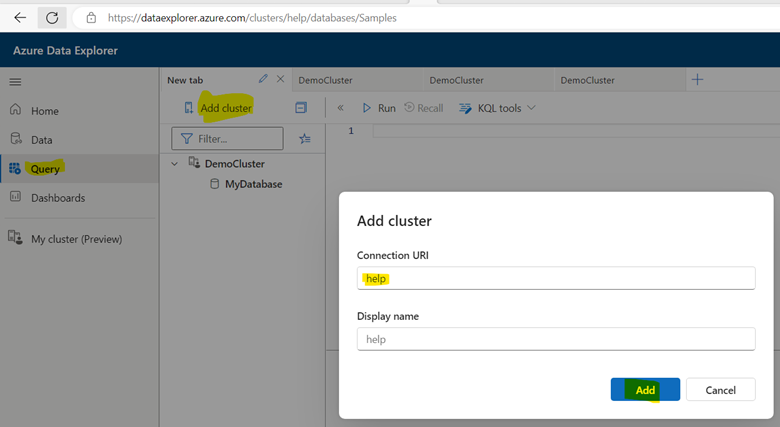
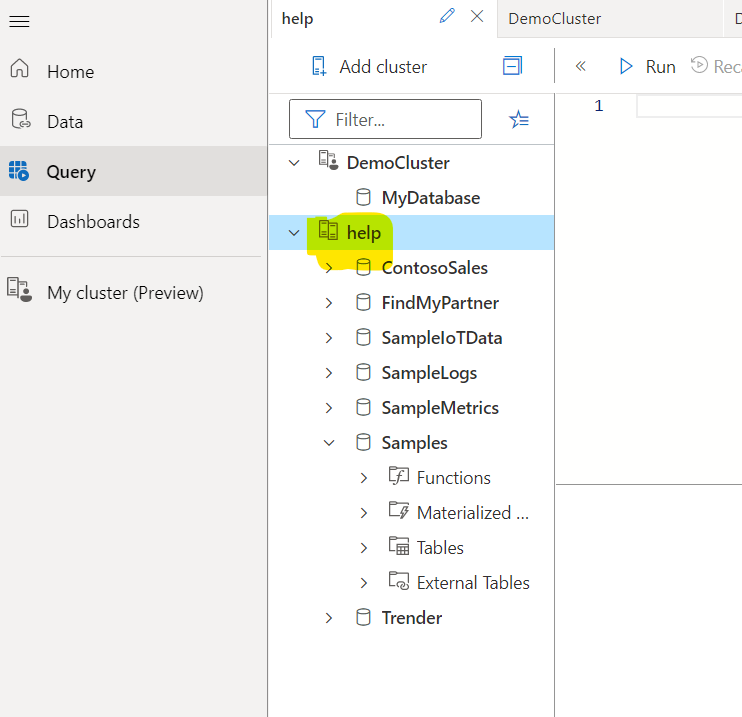
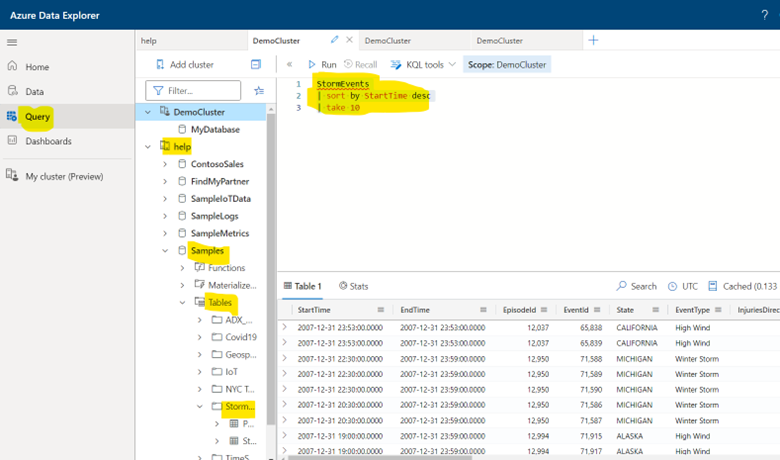
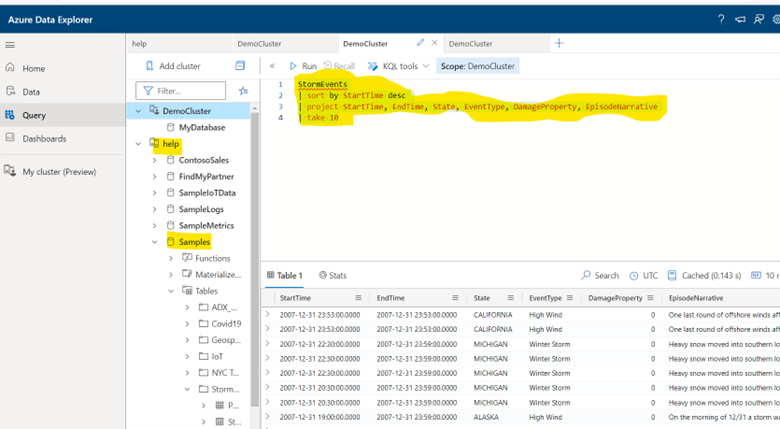
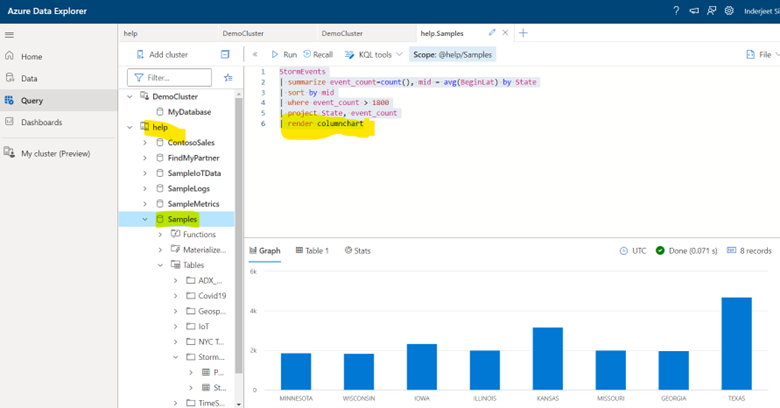
a. To create a visualization dashboard either you can browse URL (https://dataexplorer.azure.com/dashboards) or you can click on ‘Visualize’ under Dashboard on the Explorer screen.b. Once you are on the Azure Data Explorer, we will import a demo data from MS. For that click on Query from left navigation > Add cluster > in the connection URI type Help and click ADDc. You should see a new Help database is added to the screend. You can run few queries to confirm you are getting proper details and result on this screen. I will use strom database with below queries: StormEvents | sort by StartTime desc | take 10e. Another sample query we can try is StormEvents | sort by StartTime desc | project StartTime, EndTime, State, EventType, DamageProperty, EpisodeNarrative | take 10f. In this example I used render as columnchart StormEvents | summarize event_count=count(), mid = avg(BeginLat) by State | sort by mid | where event_count > 1800 | project State, event_count | render columnchart
3. Finally we are ready to create Visualization Dashboard
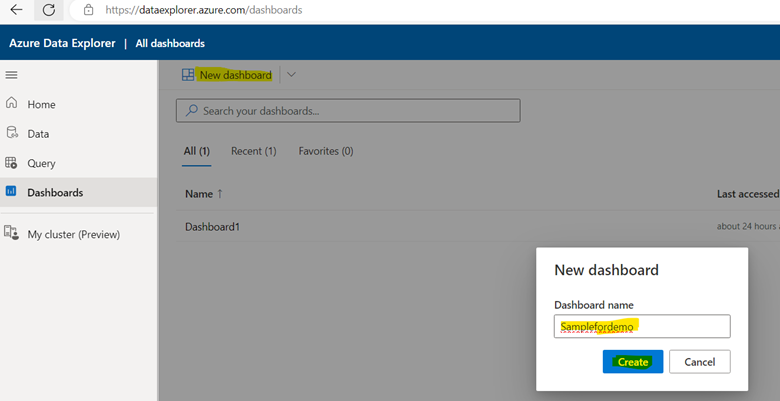
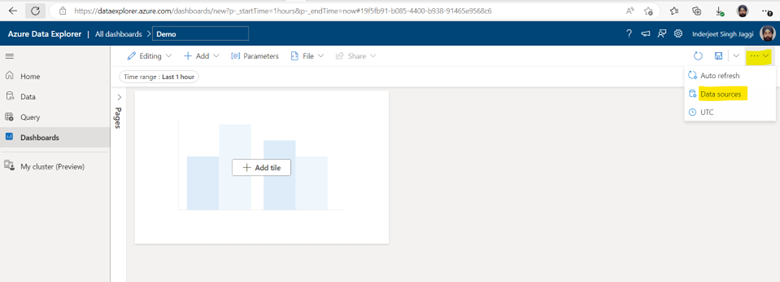
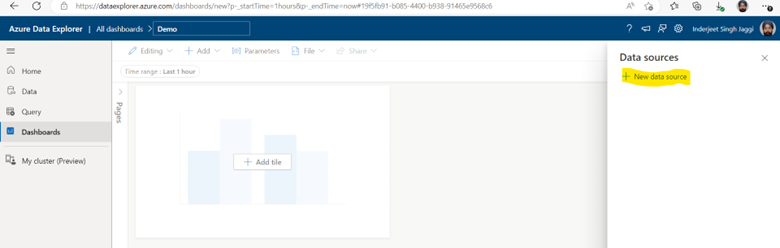
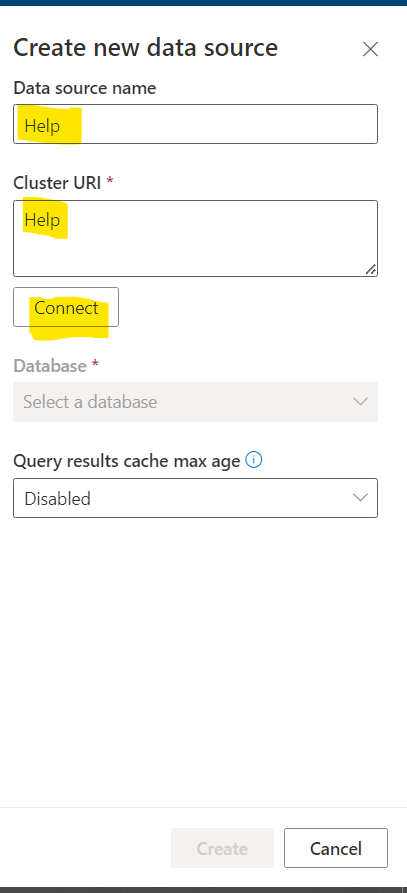
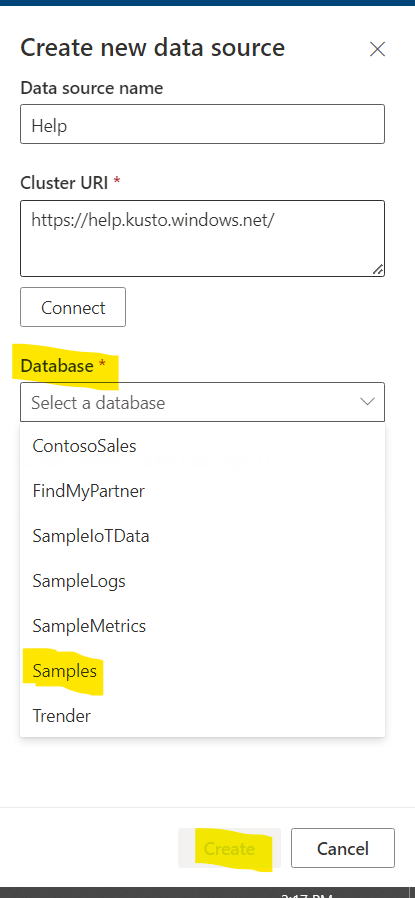
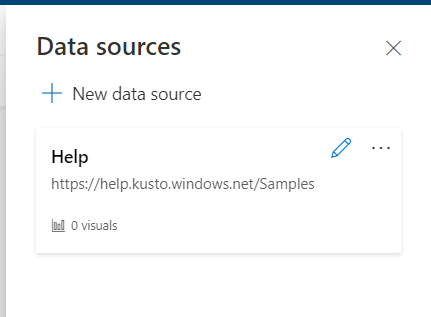
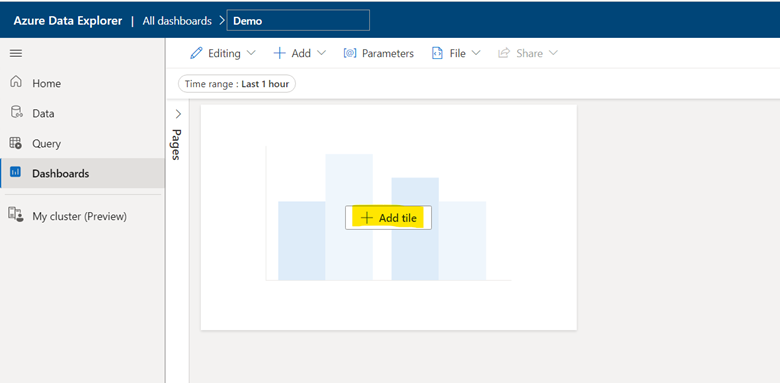
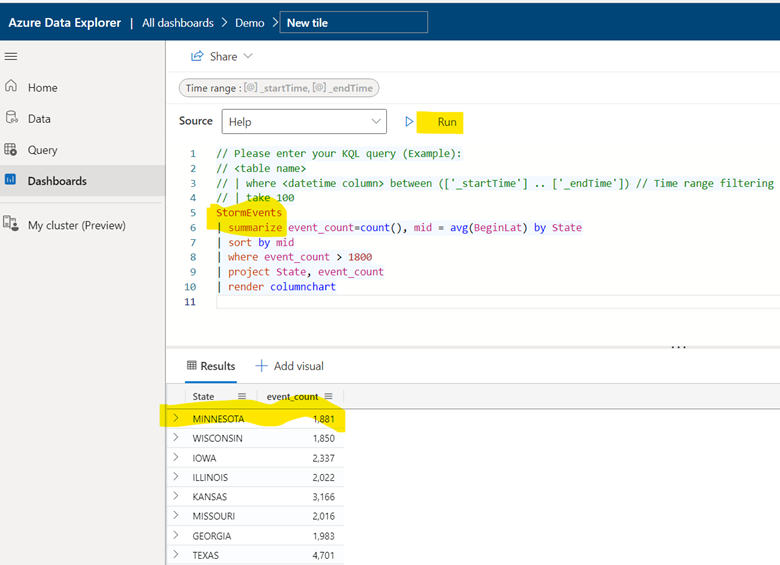
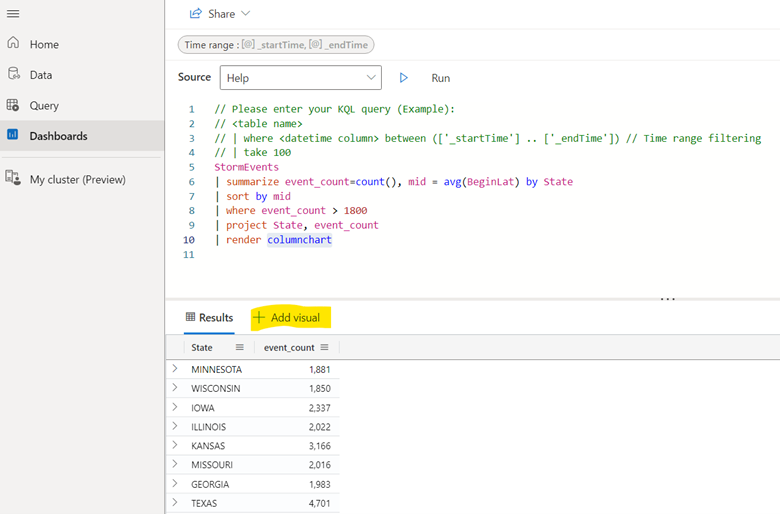
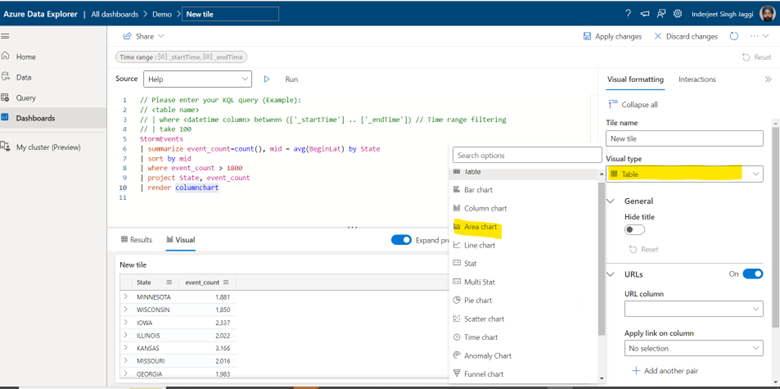
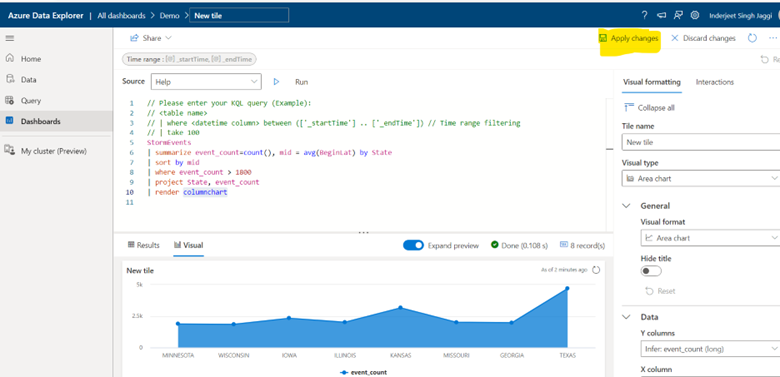
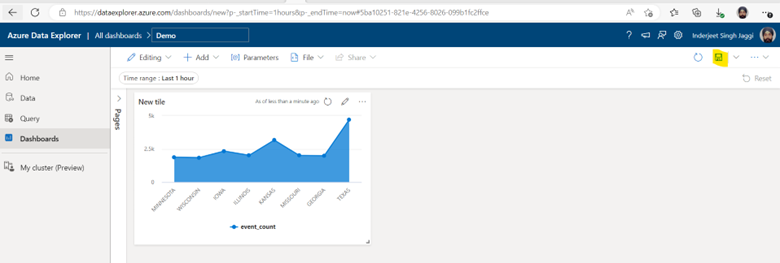
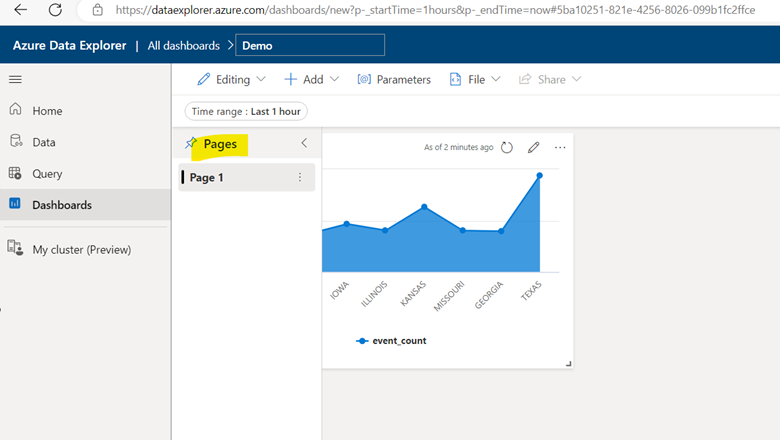
a. Now we are ready to create Dashboards, select Dashboards > Select ‘New Dashboard’, provide a name such as ‘Samplefordemo’ and select ‘create’b. Once a Dashboards screens is created, we will have to use our database connection from right navigation. Click on 3 dots on right and then select Data sources.c. Select ‘New data source’ optiond. Type the name of database > in Cluster URI type ‘Help’ and then select ‘Connect’e. Once connected, we will be able to see all the databases, we need to select Samples database we tested above and select create at bottom of screenf. Now we should see the samples added to the dashboard so we can cancel this screen.g. Now on home screen, we need to click on Add title.h. Here we can type the query for the database and select RUN. We should see some data at the bottom of the screen. StormEvents | summarize event_count=count(), mid = avg(BeginLat) by State | sort by mid | where event_count > 1800 | project State, event_count | render columncharti. Now select ‘+ add Visual’j. Select any of the option from visual type and you can make many more changes as per chart selected. Once done, select Apply Changes.k. Your Dashboard is now ready and can be saved and shared with your colleagues. You can add more charts to this page by select Add on top.If all your charts don’t fit to this screen or you want to segerate them you can create pages based on department and teams.